
Collection Analytics
NFTGo.io provides multi-dimensional data and charts for each individual NFT collection, helping users with the following:
- Evaluate value of NFT collection and individual NFTs
- Analyse holder trends
- Discover whale wallets in the collection
- Track overall profit of top traders within the collection
- Keep updated with collection activities
This page runs through the different aspects of the collection page and its functionalities.
Overview | Quick Access to Key Collection Metrics
An overview of the collection is shown at the top of the collection page. Key collection metrics such as that of Market Cap, Number of Holders, 24H Volume and Floor Price are clearly shown. This allows users to have a quick gauge of the collection's performance and decide if they wish to look into more details. The verified collection link is also embedded within this portion, allowing users to toggle to the collection's webpage for more information.

Overview | Price
This portion of the collection page depicts the key price metrics, including that of:
- Floor Price
- Average price
- Max Price
- Min Price
The analytics are further refined, by indicating whether the sales made are that of a normal wallet or a whale wallet, allowing users to quickly pick up whale movements in collections.

Overview | Market Cap & Volume
The Market Cap & Volume of the collection can be seen over the desired time range selected.
Note: The start date for this chart is based on when the collection first conducted any activities (mint, burn, send, receive etc.). This holds true for all other charts in the collection page.

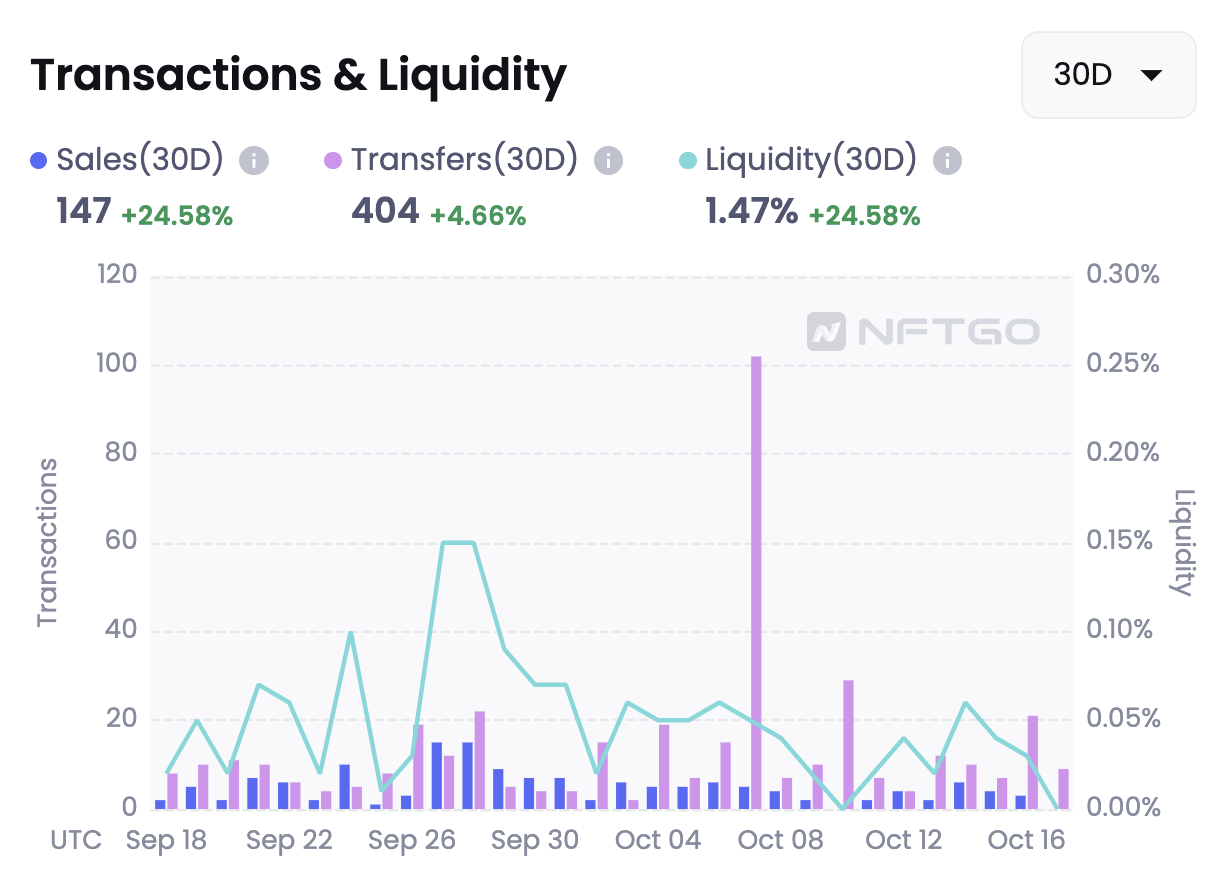
Overview | Transactions & Liquidity
Users will be able to view the transactions (Sales and Transfers) that have taken place over the timeframe they wish to analyse.
Overview | Holders & Traders
The number of holders and traders, further broken down into buyers and sellers will be analysed and charted. This allows users to evaluate the strength of a collection, and whether a certain period of time might be a good opportunity to trade.

Overview | Top Sales
The NFTs sold are ranked according to the last sold price. Several pieces of information pertaining to the sales are also shown, including that of the owner and time of sale.

Buy NFTs
NFTs from the collection listed on the multiple marketplaces supported on NFTGo will be displayed on this page. Users will be able to purchase their desired NFT straight from this page. To allow for easy searching of the desired NFT, the traits and rarity are all incorporated within the page itself. This creates a seamless NFT buying process for users.

Mint
To allow for users to keep up-to-date with the latest mint data, the key metrics featured within the Mint dashboard are updated real-time and includes the following:
Total Mints
Under this section, users will be able to monitor the total number of mints that have taken place for the collection. To further aid users in understanding the true demand for the collection, a 'Suspicious Mints' feature has been built. This feature displays the percentage of mints that are likely to be suspicious and does not contribute to the true demand.
Unique Minters
On top of the number of unique minters for the collection, this feature also indicates the number of blue chip holders and whale minters.
Average Mint Price
Mint Duration
Mint | Mint Trends
A visual representation of the Total Mints and Unique Minters over time (from first mint to last mint), serving as an indication of the market's interest for the collection.
Mint | NFT Circulation Distribution
Under this portion, NFTs are split into 2 categories: (1) NFT that has undergone no sales (2) NFT that has undergone at least 1 sale. This allows users to analyse the trading activity that occurs for each collection.
Mint | Holding Period Before First Sale
Currently included under the holders portion.
Mint | All Mint Activities
Mint | Top Minters
Listing | Dashboard
At the top of the Listing section, a dashboard gives a brief overview of some key listing metrics, including the following:
- Number of Listings
- Last Price Listed
- Number of Holders with Listings

Listing | Key Factors
The above mentioned key listing metrics are also shown in a chart, allowing users to view the trend over the desired timeframe. A visual representation grants users the ability to look at a collection's performance over a certain period of time much easier.

Listing | Floor Depth
Floor depth refers to the breakdown of unique listings for a collection, showcasing the best price from notable marketplaces. This is updated real-time and allows users to have a grasp of the general pricing of the collection listings with a glimpse of the chart.

Listing | Listings & Recent Sales
Collections listings are updated real-time, alongside the recent sales. Users are able to sort the listings according to their preferred method.

Holder | Blue Chip Potential
The Blue Chip Potential feature estimates the potential for a collection to become the a Blue Chip Collection. This is based on two aspects:
(1) Blue Chip Holders
The first would be the number of blue chip holders in the collection. This feature goes into further details by quantifying the percentage of the collection held by blue chip holders. Users can also take a look at some of the other major blue chip collections which these blue chip holders hold onto.
(2) Whales
The other aspect would be the number of whales within the collection. Similarly, the percentage of the collection held by whales is quantified.

Holder | Holder Trends
A chart including the number of holders, whales and blue chip holders has been incorporated to give users a visual representation of the trend in collection holders over a period of time.

Holder | Holding Period Trends & Distribution
The holding period by buyers of the collection can be found here. The holding periods are broken down into the following periods:
- Less than 24H
- 1 - 7D
- 7 - 30D
- 30D - 3M
- 3M - 1Y
- More than 1Y


Holder | Holding Amount Distribution
This feature breaks down the number of NFTs within each collection held by the holders. This allows users to be wary of any one holder that might be holding onto a large number of NFTs, posing a possible risk that the NFTs might be dumped.

Holder | Top Holders
An overview of the top holders, whales and blue chip holders is provided. This is a detailed overview that consists of the following information:
- Number of NFTs (NFTs)
- Holding Value
- Estimated Holding Value (Est HV)
- Profit & Loss (PnL)
- Buy Volume
- Sell Volume
- Last Deal
Users are allowed to rank the holders according to the metric of their choice, depending on what they seek to infer.

Leaderboard | Profit Leaderboard
This dashboard shows the addresses with the highest profits made. Specific details pertaining to the profits are also shown, including that of:
- Buy Volume
- Sell Volume
- Sent
- Received
- Minted
Users are able to have a gauge as to where the profits came from, be it from trading off the secondary market, or from minting the collection.

Leaderboard | Top Buyers & Sellers
Users will be able to track the top buyers and sellers of the collection. Specifically, the volume and quantity of the transaction can also be seen, across different timeframes.

Activity
This page displays all of the activity that takes place in the collection, including both transfer and sale. This gives users an indication of the activity of the collection.

Updated 10 months ago