
Collection Analytics
NFTGo provides multi-dimensional data and charts for each individual NFT collection, helping users with the following:
- Evaluate value of NFT collection and individual NFTs
- Analyse holder trends
- Discover whale wallets in the collection
- Track overall profit of top traders within the collection
- Keep updated with collection activities
This page runs through the different aspects of the collection page and its functionalities.
Collection Homepage | Quick Access to Key Collection Metrics
An overview of the collection is shown at the top of the collection page. Key collection metrics such as that of Floor Price, Total NFT Sales Volume, Market Cap and Number of Holders. This allows users to have a quick gauge of the collection's performance and decide if they wish to look into more details. The verified collection link and socials are also embedded within this portion, allowing users to toggle to the collection's webpage for more information.

Let's first take a look at what is available in the 'Overview' tab of a collection page.
- Overview
- Overview
Overview | Dashboard
Off the bat, users get to have a rough idea of how the collection has been performing, particularly looking at the last 24 hours. The metrics displayed include:
- Floor Price
- Volume (24H)
- Sales (24H)
- Average Price (24H)
With this, users can easily identify whether there has been any significant fluctuation that occurred over the past 24 hours, through both the change in percentage and chart display. Should there be a huge increase or decrease, this would likely pique user's interest to take a look into the collection to understand if there were any catalysts or events that might have occurred.

Overview | Price & Sales
This portion of the collection page depicts the key price and sale metrics, including that of:
- Floor Price
- Average price
- Normal Sales
- Whale Sales
The analytics are further refined, by indicating whether the sales made are that of a normal wallet or a whale wallet, allowing users to quickly pick up whale movements in collections. In addition, users are able to choose the timeframe they wish to analyze, and identify the trends in the market.

Overview | Featured NFTs
Some of the hot and trending NFTs within the collection will be featured in this area. If users come across any NFTs they are interested in, they can easily purchase it with the 'Buy Now' button.

Overview | Listing Data
Under this portion there are 2 metrics shown:
- Listed: Number of listed items is shown as a percentage of the entire collection size
- Listed at floor (~15%): Number of items listed within floor price x (1 + 15%) range shown as a percentage of the entire collection size
These are metrics that reflect holders' confidence in the collection.
If the 'Listed' metric has a low percentage, it could mean that the holders are confident in the collection and think they will continue to perform better in the long term. As such, they are not yet willing to list the NFT.
A collection with a low percentage of NFTs listed at floor indicates that the holders believe the collection is undervalued, and their particular NFTs can fetch a higher value. Thus, they are willing to list their NFT at a price higher than the floor price, despite this meaning that it might take longer for a buyer to pick it up.

Overview | Mint Trends
This section depicts the number of unique minters and whales that participate in the minting. More regarding this metric will be discussed in the 'Analytics' tab below.

Overview | Holder Trends
This highlights the trend of holders over time and number of whales holding the collection. More regarding this metric will be discussed in the 'Analytics' tab below.

- Analytics
- Analytics
General | Market Cap & Volume
The Market Cap & Volume of the collection can be seen over the desired time range selected.
Note: The start date for this chart is based on when the collection first conducted any activities (mint, burn, send, receive etc.). This holds true for all other charts in the collection page.

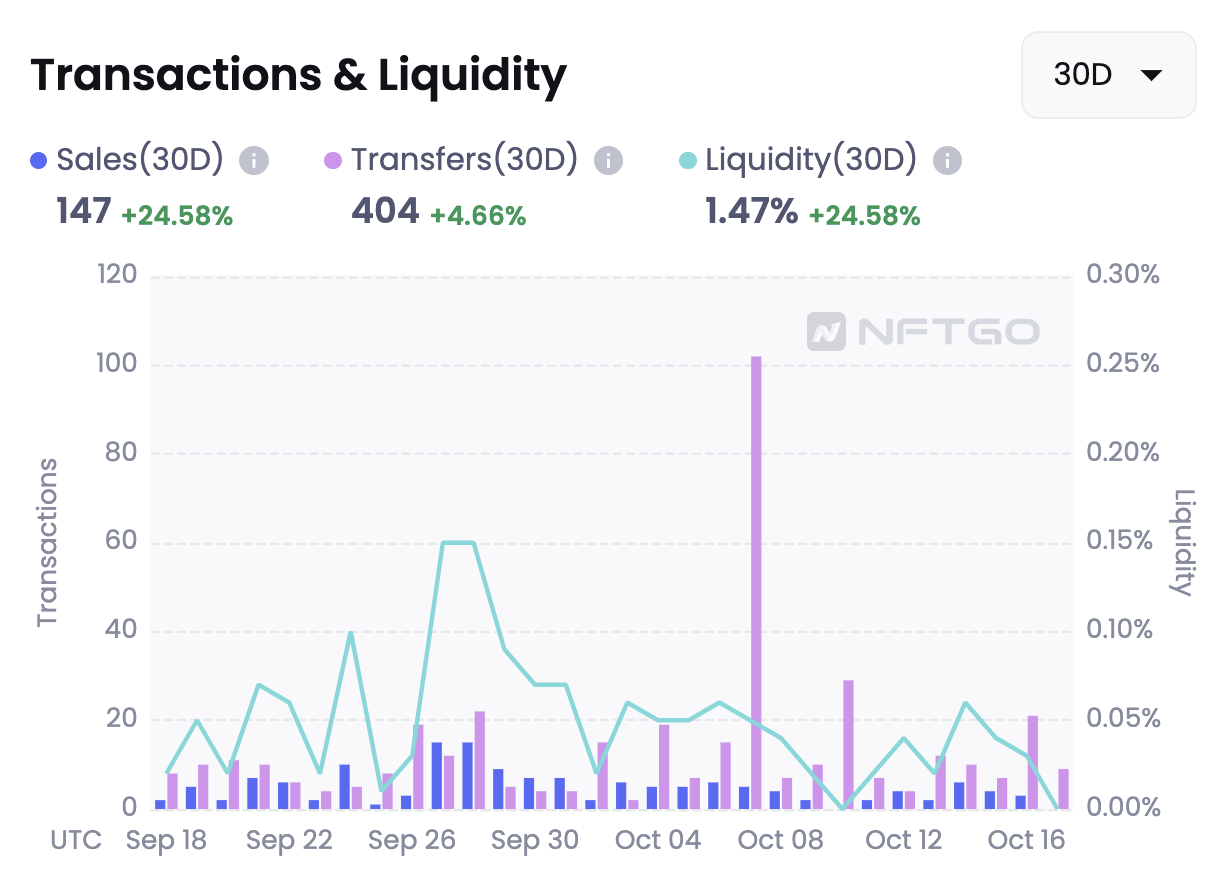
General | Transactions & Liquidity
Users will be able to view the transactions (Sales and Transfers) that have taken place over the timeframe they wish to analyze. From this chart, users can also find how liquid the collection is.
General | Holders & Traders
The number of holders and traders, further broken down into buyers and sellers will be analyzed and charted. This allows users to evaluate the strength of a collection's community, and whether a certain period of time might be a good opportunity to trade.

General | Top Sales
The NFTs sold are ranked according to the last sold price by default. Several pieces of information pertaining to the sales are also shown, including that of the owner and time of sale.

Summary
For more detailed analytics regarding a collection, do refer to the following sections
- Mint Analytics
- Holder Analytics
- Collection Leaderboard
Updated about 1 year ago