
NFT Item Analytics
After discovering collections, be it through trending collections, or from tracking whale wallets, the next step would be to identify which particular NFT to purchase. This is where it becomes essential to analyse the NFT specific traits to determine the value of the NFT.
Rarity
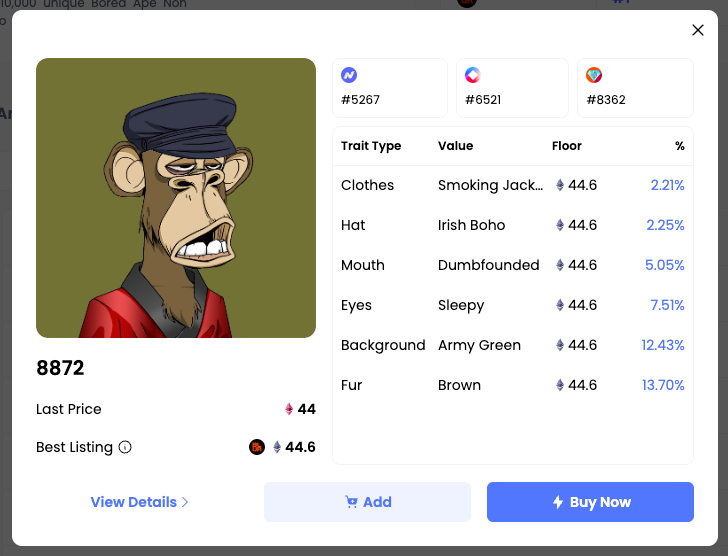
With most NFTs, rarity plays an important role in determining whether the NFT will be priced at floor price (lower rarity) or trade at a premium from the floor price (high rarity). This rarity is very often determined by (1) Number of traits (2) Rarity of individual traits. These are all clearly displayed in the 'Rarity' portion when users click into a particular NFT. On top of which, the rarity rank across different NFT rarity tools are also displayed. With these information, users will be able to determine whether the NFT ranking is something they are willing to pay for, and if it is, they will be able to either add the NFT to cart or purchase it immediately.
Dashboard
On top of the last price sold and listing price, both of which gives a rough indication of the market's pricing of the particular NFTs, there are some other information available too. With information such as 'Past Owners', users are able to see the number of owners that have held the NFT since its mint date, also readily available within the dashboard. The other information available would be the 'Current Holding Time', giving users an indication of how long the NFT has been held since it was either minted or bought.
Note: 'Current Holding Time' is only applicable for ERC-721 collections, because for ERC-1155 NFTs, it's hard to distinguish specific NFT. For ERC-1155 collections, you can find another metric called "Largest Holder" here.

Dashboard for ERC-721 NFT

Dashboard for ERC-1155 NFT
Price History
Other than providing users with the current floor price of the NFT, a graph is also displayed to show the change in NFT price over time. This visual representation helps to give users an idea of how well the NFT has performed in terms of price over the period desired.
Should it be a rising trend with the floor price constantly increasing, this is a good sign as it shows the attraction that the NFT has been gaining.

Activities
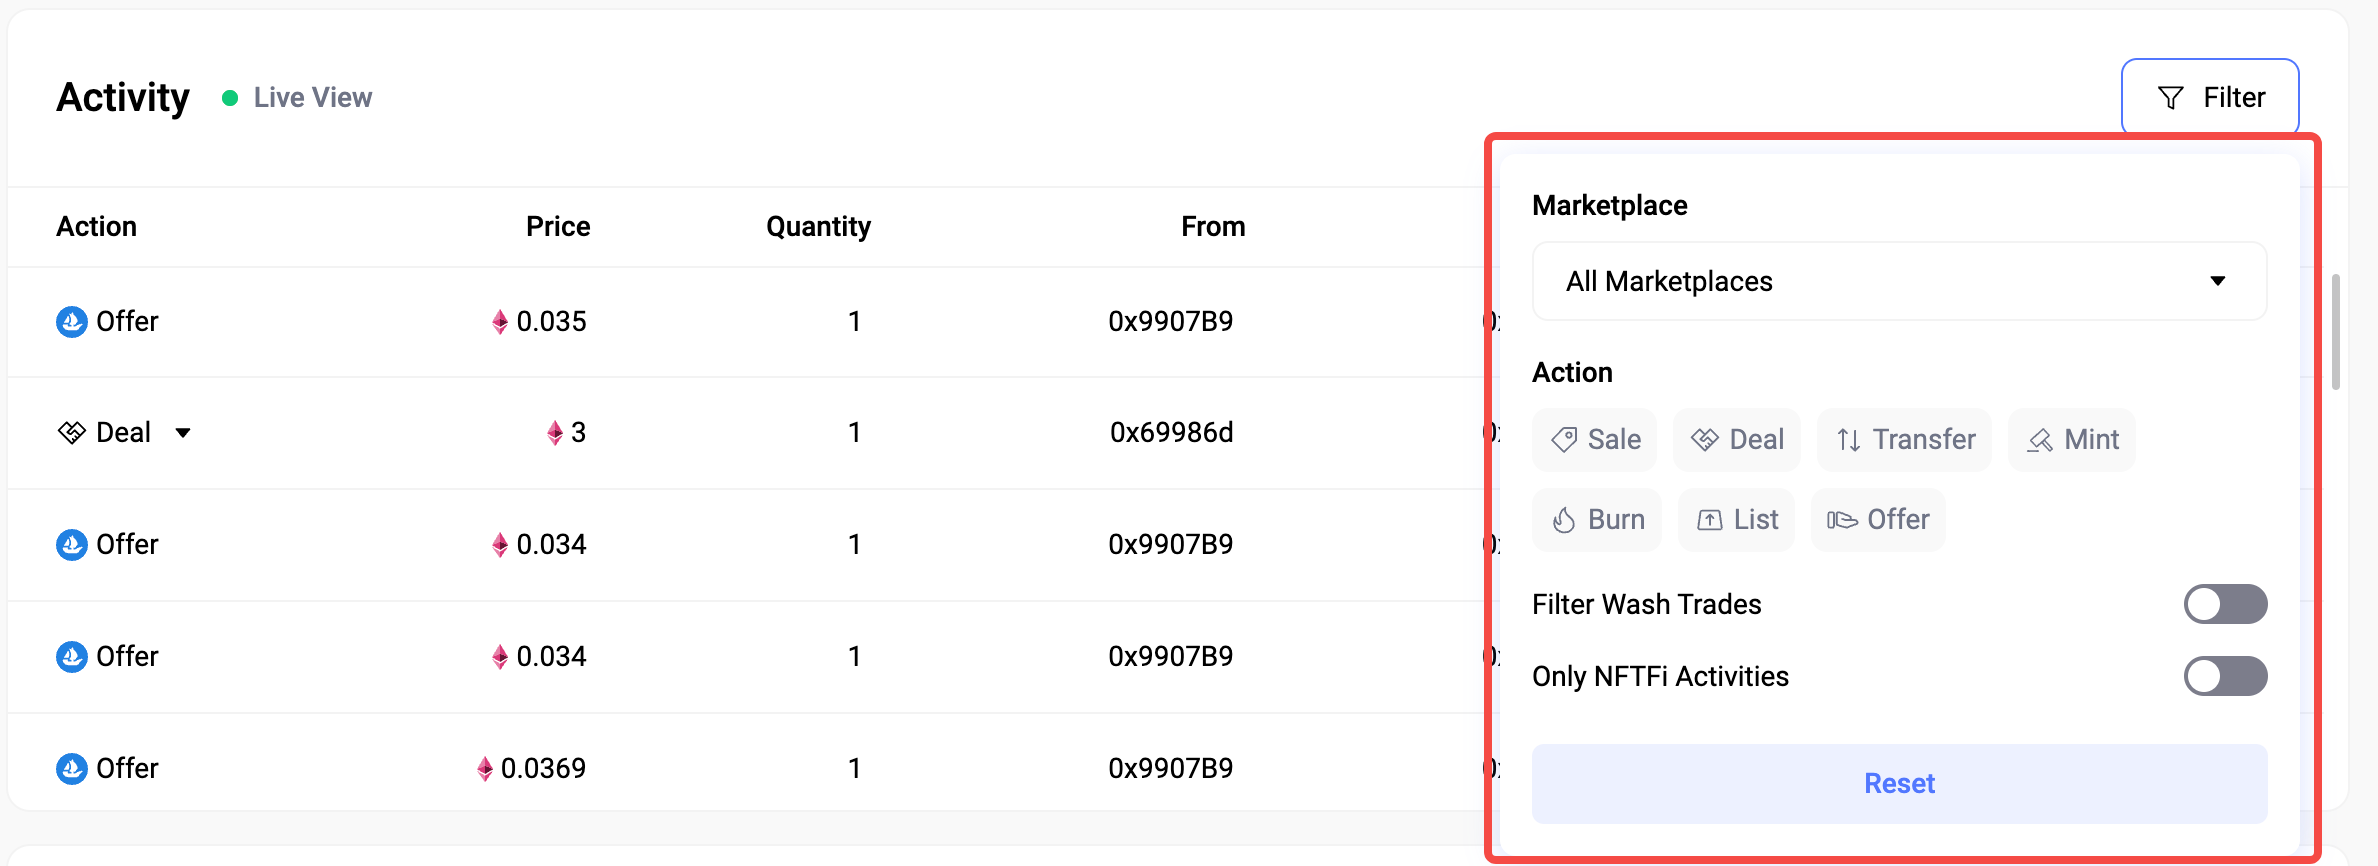
The detailed activity of the individual NFT can also be found. Users will be able to observe the 'sale', 'transfer', 'mint', 'burn', and 'list' activities of this NFT item. This will include details such as the addresses involved in the activities, the quantity and gas fees (show USD price in tooltip) used. Furthermore, this dashboard allows users to do various advanced filters which includes:
- filter to show activities happened in specific marketplaces
- filter to show certain types of activities including sale, deal, list, offer, collection offer, transfer, mint, burn
- filter out all wash-trading activities
- Only show NFTFi Activities

Updated about 1 year ago