
Pro Trade (Snipe)
Short term traders in the NFT market require a different set of metrics to help them make better decisions. They are unlike investors or longer timeframe traders who have the luxury of time to step back and look at the broader market trend. Short term traders have to look at more local metrics, and in particular, metrics that are updated real-time. This is an underserved group of users within the NFT space, and NFTGo is here to provide solutions.
The Pro-Trade tool comprises of various metrics, that will help users to track
- The latest trading transactions
- Price distribution of listings
- Power of buyers and sellers
- Floor Depth of this collection
All of the above will aid users in determining the short-term trend of the collection, and allow them to choose the best time to buy or sell.
Let's take a deeper look into the features provided.
Filter
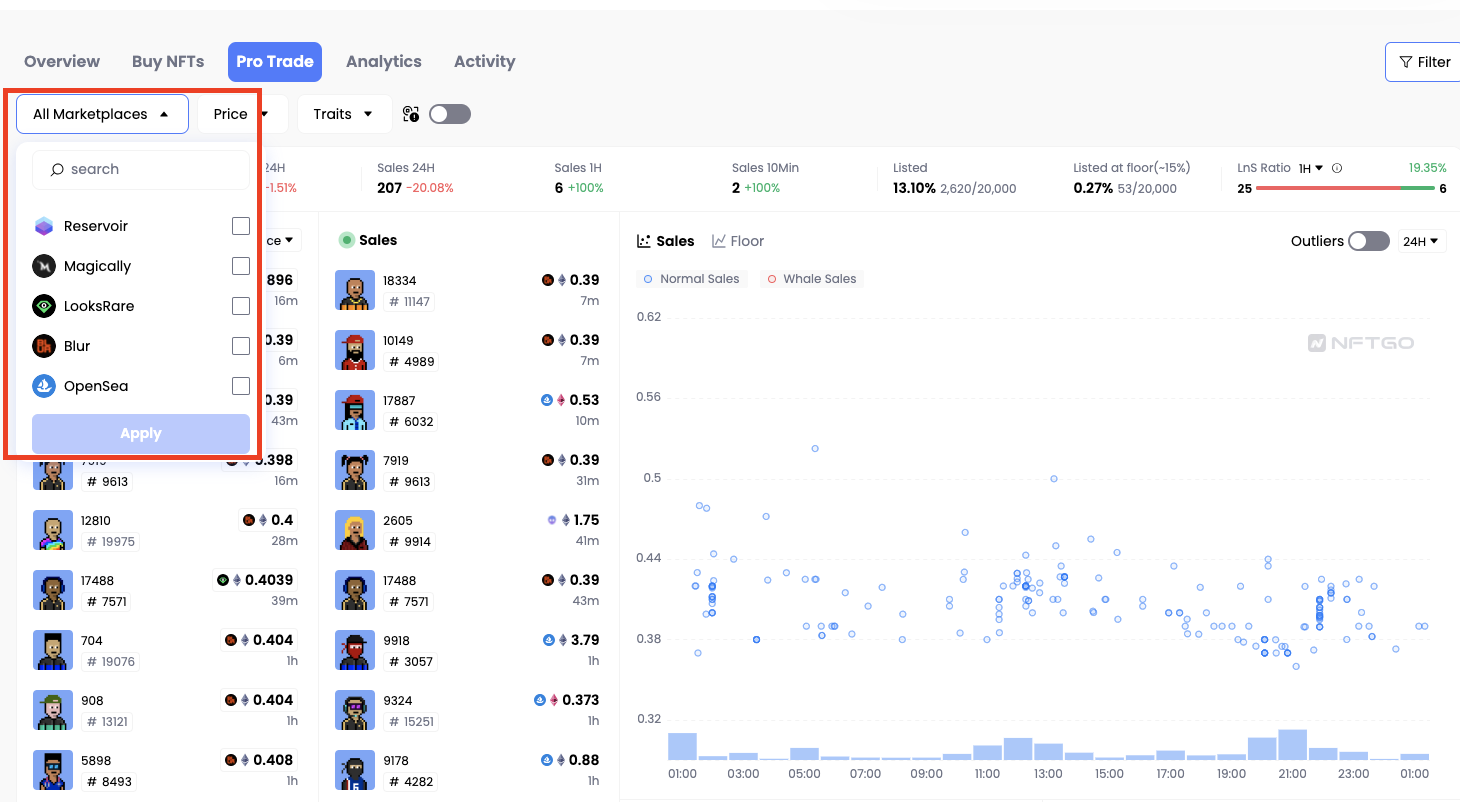
Users can select specific traits, price range and marketplaces to filter out corresponding info. This allows users to look up the historical data with specific traits, price range and marketplaces for easier reference, which is quite useful. There are several points to note about the filter:
- listings, sales feed are filtered first, then take the maximum 3000 orders
- The filter will not be shown in big collections that have more than 150,000 items, including: Rarible, The Merge: Regenesis, Gods Unchained, CryptoKitties, Unstoppable Domains, MekaApes Game by OogaVerse, Foundation (FND), More Loot, OpenSea Shared Storefront, Art Blocks, The Sandbox LAND, KnownOrigin, ENS: Ethereum Name Service, Axie Infinity(ETH), Sorare, Uniswap V3 Positions
- The price range filter and marketplace filter don't apply to some tables.
| Whether price range applied to | Whether marketplace applied to | |
|---|---|---|
| Listed (number) | ✅ | ✅ |
| Listed line chart | ❌ | ✅ |
| listed at floor (~15%) number | ❌ | ✅ |
| listed at floor (~15%) line chart | ❌ | ✅ |
| Listing&sale Ratio | ✅ | ✅ |
| Listings feed | ✅ | ✅ |
| Sales feed | ✅ | ✅ |
| Trades | ✅ | ✅ |
| Trades volume bar | ✅ | ✅ |
| Floor chart | ❌ | ✅ |
| Floor volume bar | ❌ | ✅ |
| Floor depth | ✅ | ✅ |
| Listings trends line chart | ❌ | ✅ |
- Listing time of Cryptopunk is shown by on-chain time.
Dashboard

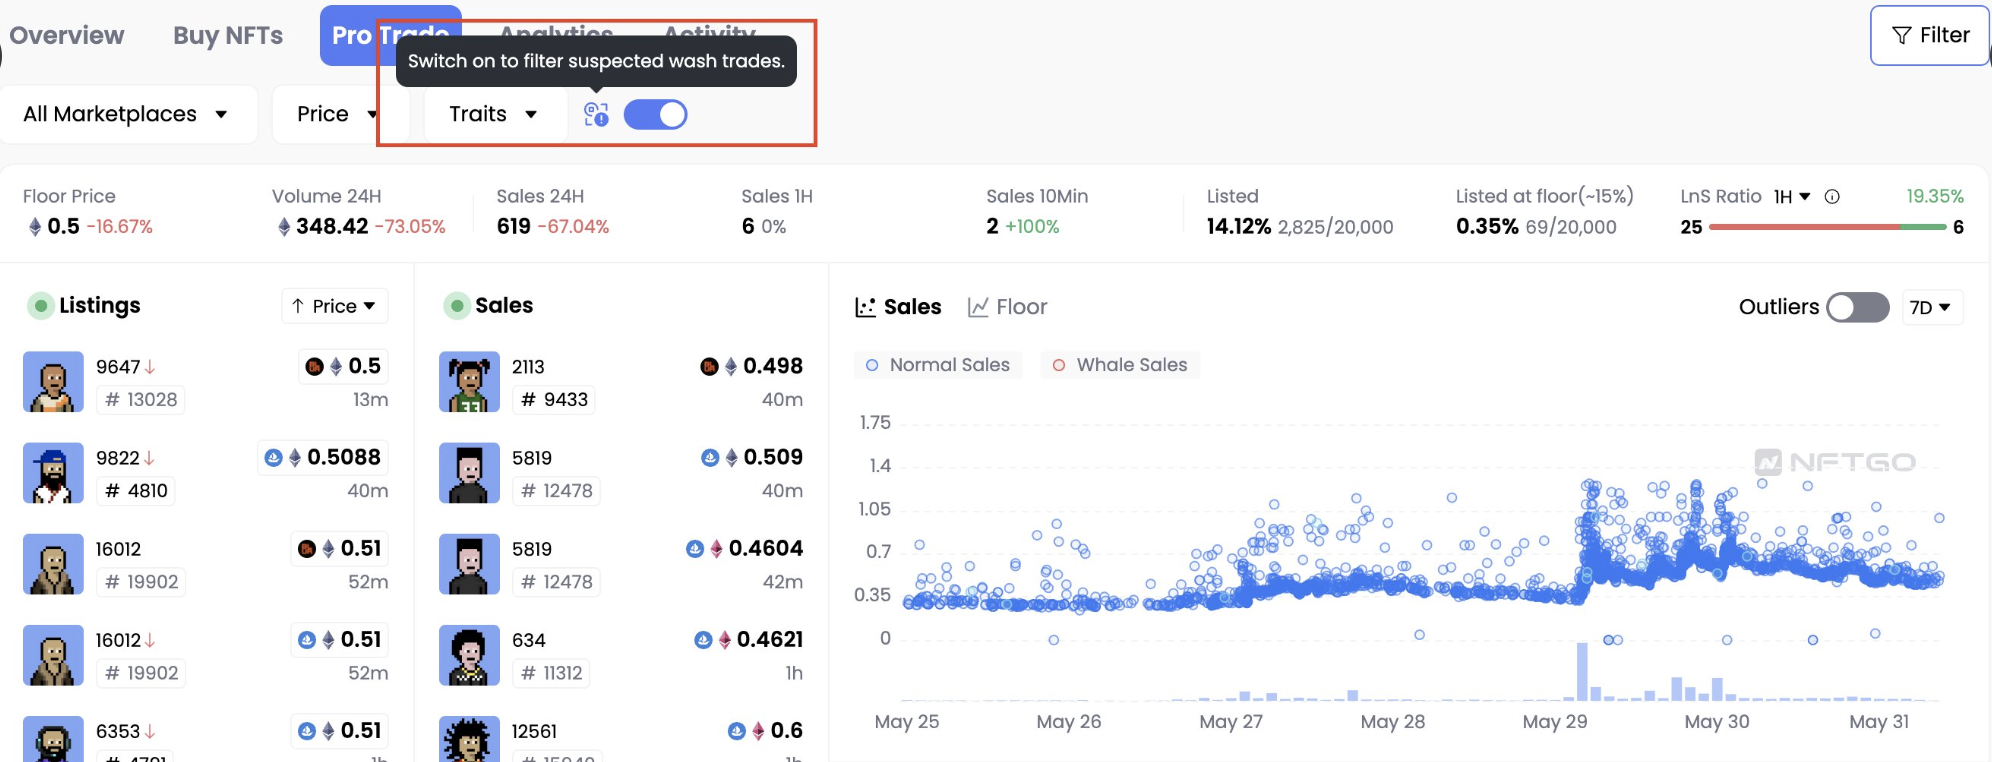
Plus, users can filter wash trades with one-click. When the button is switched on, all sales indicators, lists, and charts will automatically filter out wash trades. So that users can make more accurate judgments based on more real transaction data.
Listed
This shows the quantity of NFTs within the collection that has been listed as a percentage. The chart beneath it reflects the changes in 24 hours.
A collection that has a low percentage of NFTs listed indicates strong hodling power within the hodlers. This usually indicates a strong community, with a large majority of people hodling, instead of selling. In general, it is beneficial towards the floor price given that the supply of the NFTs within the market is low. With this, traders would likely look towards buying into the collection and stand to profit from the rising floor price.
Listed at floor
With this metric, it is looking at items that are listed at:
< 1.15 x Floor PriceThe number of NFTs that fulfill the above criteria is then calculated as a percentage of the total collection size. Similarly, the chart reflects the change in this statistic over a period of 24 hours.
Should this percentage be low, it indicates that the sellers have a wait-and-see attitude and may have listed the NFTs at a price significantly higher than the floor price. This also indicates that these sellers are positive on the outlook of the collection and are expecting the floor price to increase. This sometimes provides an opportunity for short-term traders to buy from the collection and sell it for profit. Vice versa, once this percentage starts becoming higher, it indicates that the sellers are losing their confidence for the collection to increase in price, and are thus selling it near the floor price.
Listed & Sales Ratio
This features shows 3 metrics:
- New Listings
- Delisted
- Sales
The number of sales is then shown as a percentage of the sum of the above 3 metrics.
This gives users a very good comparison of the total number of listings, against the number of NFTs being sold during a specific period of time (as customized by users). The strength of sales relative to that of listing could be a metric that users use to judge the price trend. When the sales is higher than the number of listings, strong buying volume is indicated, and traders might wish to buy in, to profit from the likely upward price trend.
Vice versa, when the number of sales pales in comparison to that of number of listings, 2 points can be inferred
- People are looking to sell, increasing the selling pressure
- Demand for the NFT is not strong
These 2 points combined together are a catalyst for the floor price to drop. And this could be a signal that traders use to get out of their trade before the floor price crashes.
Listings & Sales Feed
The listings and sales are shown side by side. This is updated real-time and will allow short-term traders to identify particular NFTs that seems to be catching the attention of the market. These NFTs could be constantly listed and bought up immediately, and then listed for a higher price afterwards, all apparent through this feed. Should traders identify such pieces of NFTs, they may wish to purchase it and be part of the flipping. NFTGo makes this process seamless by allowing the purchase of the NFT to be done straight through NFTGo. This removes the need to have to toggle over to a separate marketplace in order to purchase the NFT, which could potentially cause the trader to lose out in profits given the time inefficiency. We only show the best order(the lowest price) in Listing Feed when one NFT has different listing prices at the same marketplace. And when the NFT owner lowers the listing price, it will show a 'red down arrow' to notify users.
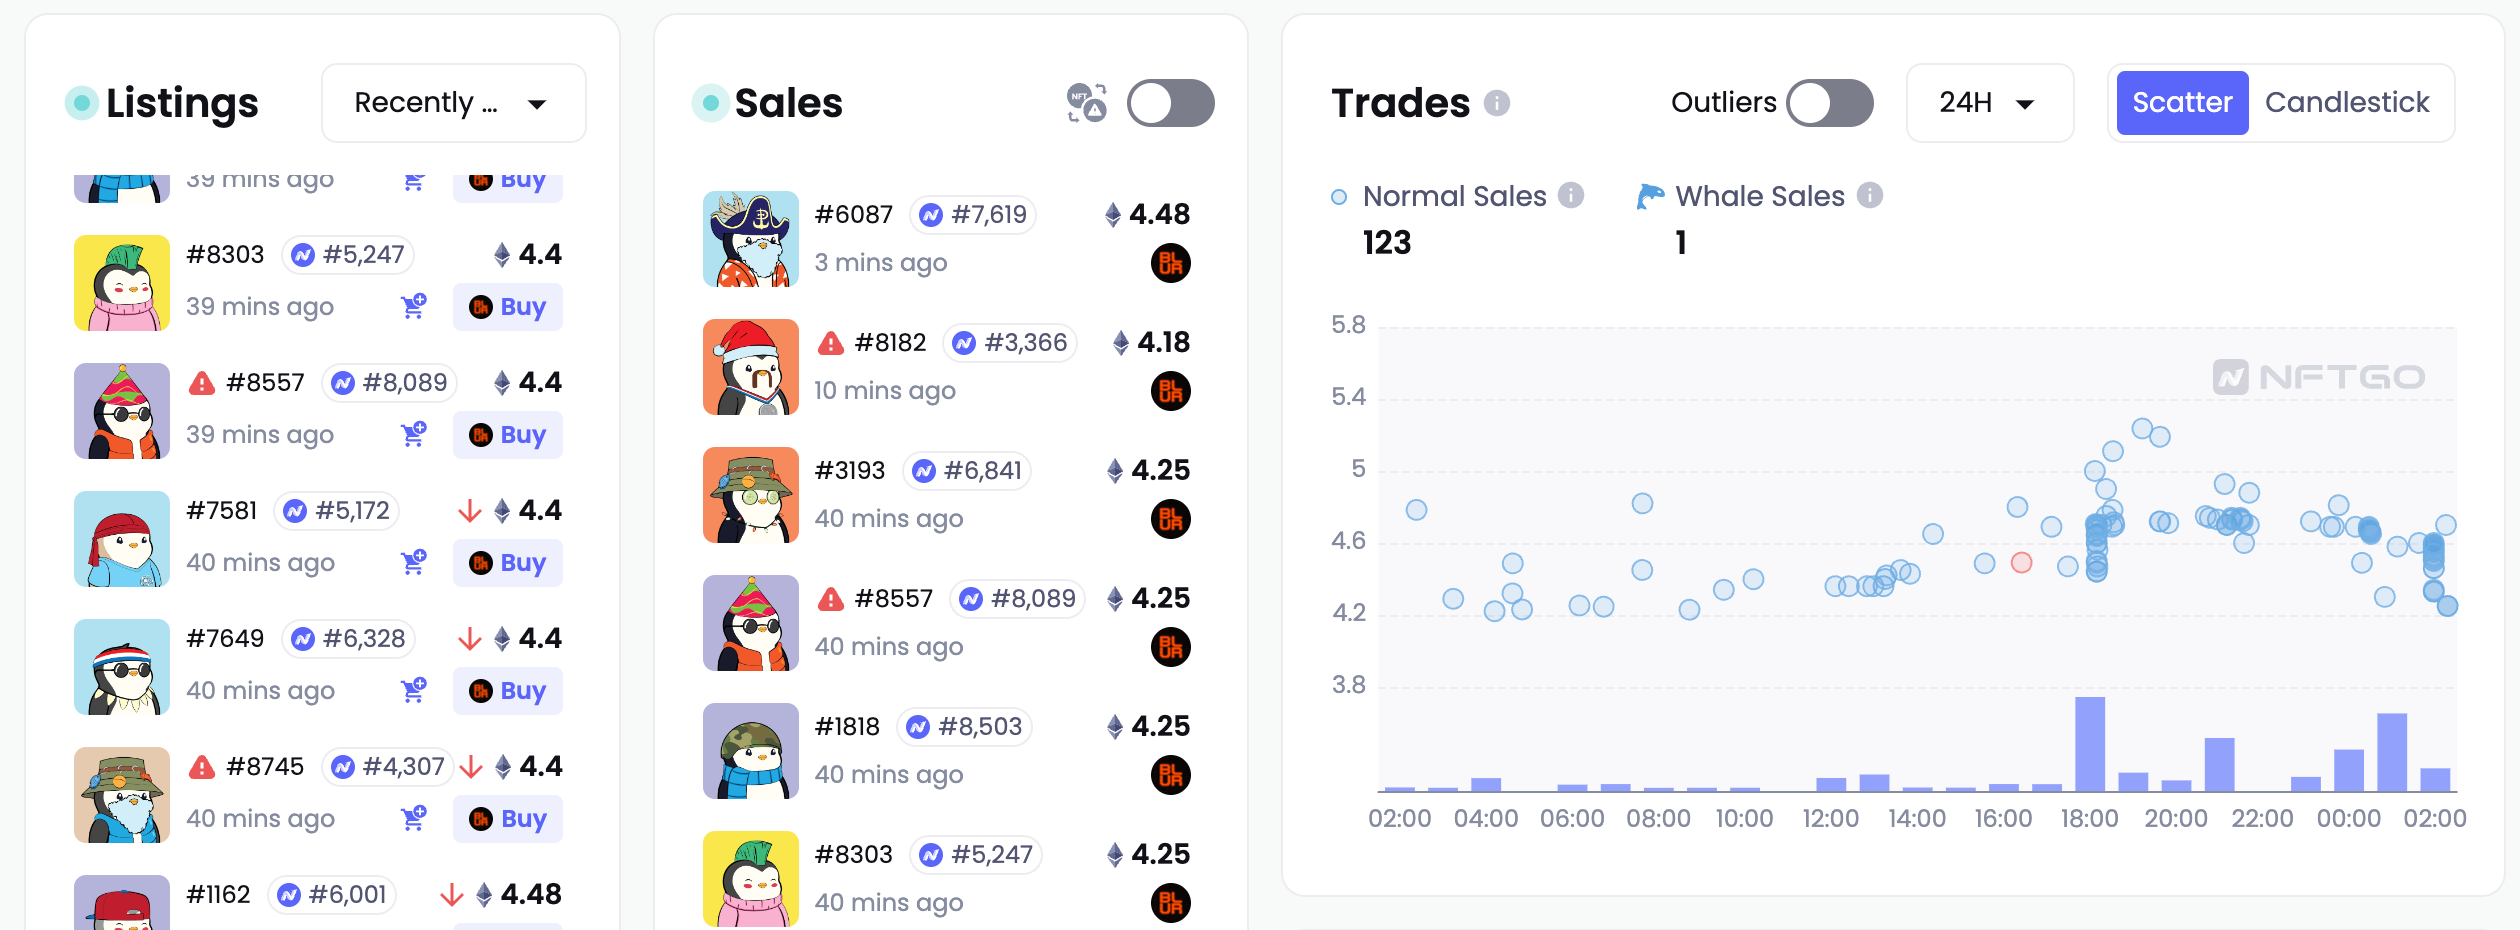
Trades Chart
Scatter
On top of adding in whale sales, volume bars are also available on this chart. These reflects the amount of buying pressure that enters the market. In some situation, increasing volume bars indicate increasing demand for the collection, and is a good signal for traders to buy the NFTs. When the volume bars are decreasing afterwards, it could be a sign that the market is no longer paying too much attention towards the collection. In this case, the trader can choose to close the trade.

Candlestick
We added a candlestick chart and drawing tools for the floor price, which allows users to better observe the trend of floor price changes and make informed decisions.
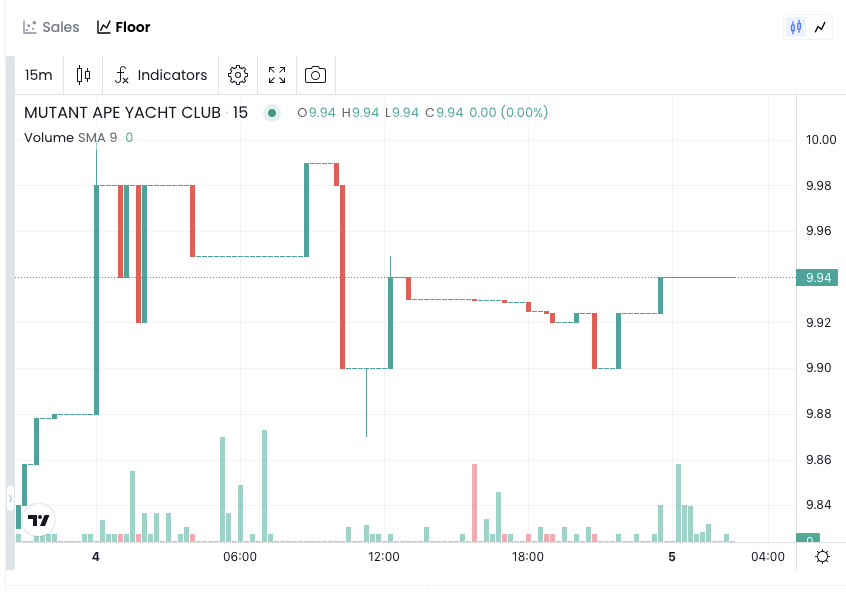
Floor Price
Track the trend of the collection's floor price over the stipulated timeframe.

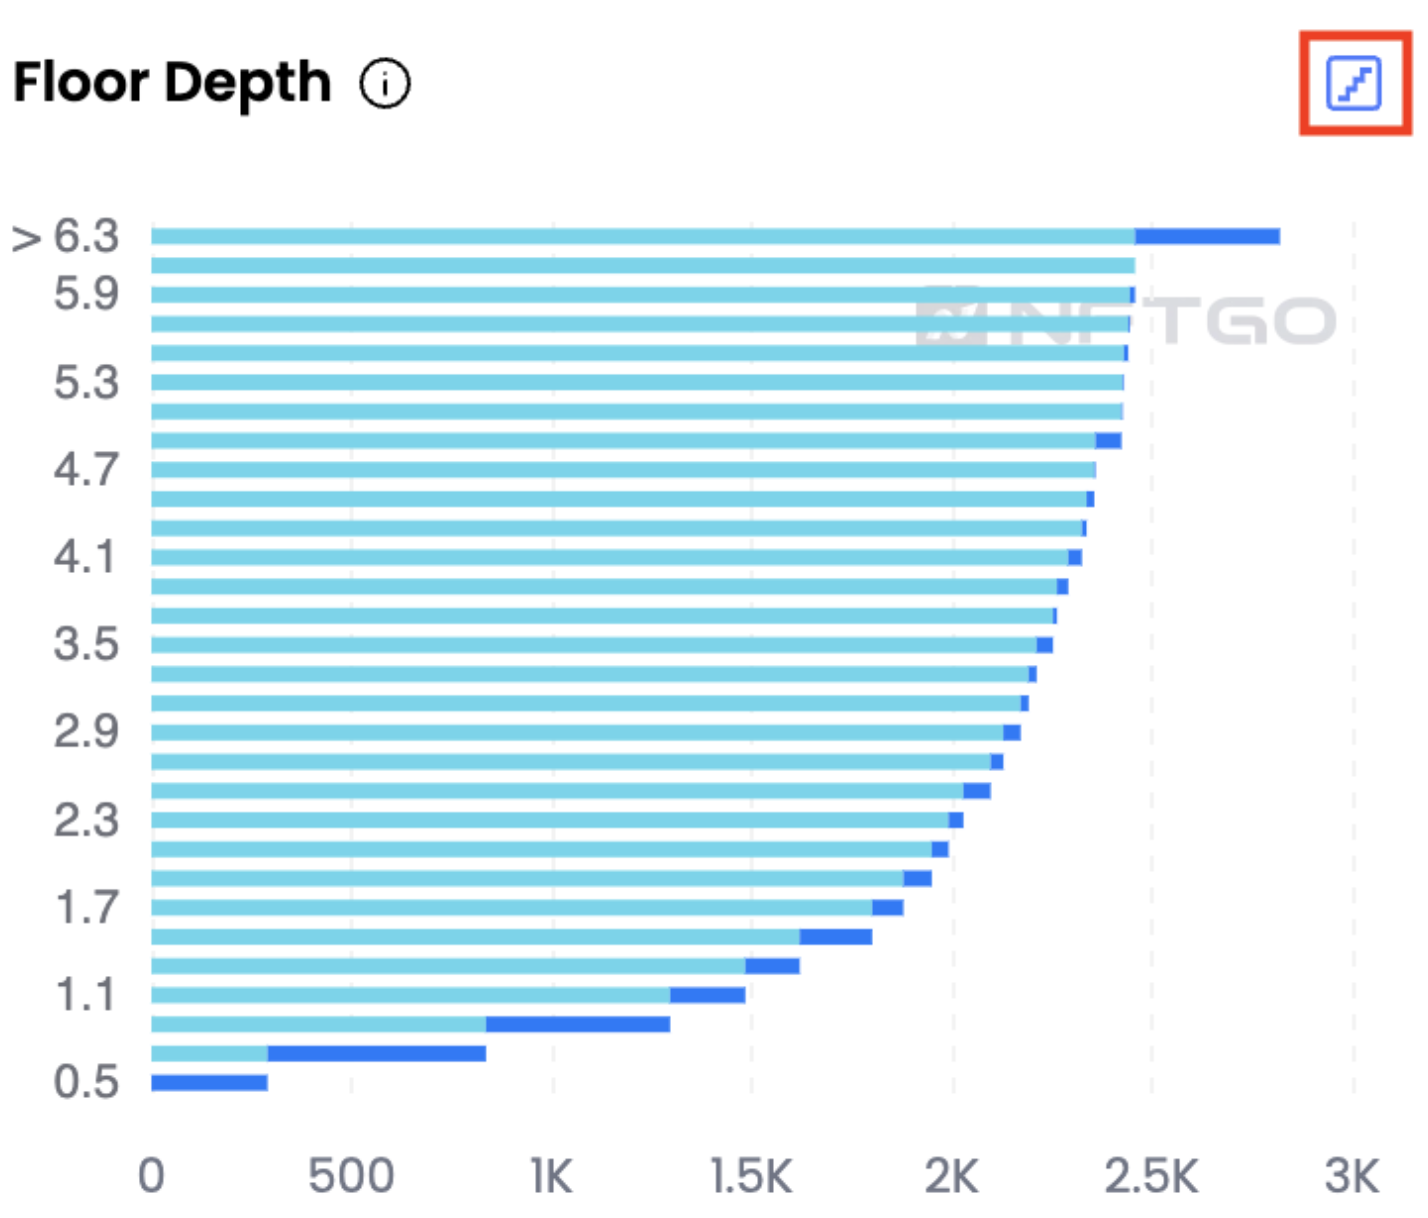
Floor Depth
The floor depth metric breaks down the unique listings based on the listing price. This gives users a reflection of the holder's confidence in the collection. This is a good visual representation of whether the collection items are being listed towards the floor. And this can also help users find out the 'selling wall' of this collection. The small button in the upper right corner can also be used to switch display modes.
Listing Trends
A visual representation of the number of listings vs number of listings at floor can be found here. When the listings at floor is extremely lower than that of the listings, it indicates the confidence the hodlers have in the collection, as they are willing to list their NFTs at a higher price. With such confidence in the collection, short term traders can consider entering a trade and purchasing the NFTs, and eventually selling it when the number of listings starts to decrease and dip below that of the listings at floor.

One-Click Purchase
With the small collection size, coupled with high demand for certain collections, it becomes important for users to be able to make purchases quick enough. With a one-click purchase, users are able to make purchases a lot quicker, beating the market to it.
Updated about 1 year ago